

YoY (Year-over-Year): Definition, Formula, and Examples
What is the YOY?
Year-over-year comparisons in financial analysis are used to assess how a company is doing in a particular area based on how it differed from the prior year. When used in conjunction with regular metrics of a business or other investment, this metric employs a straightforward equation to illustrate financial trends. Any metric that businesses report, such as revenue, gross profit, or staff hours, can be compared using YOY. A company’s leadership team can determine how its operations have changed over a 12-month period by comparing the current performance to that of the previous year at the same point.
Why does YOY matter?
For the following reasons, business executives should measure their performance year over year:
- Seasonal variations are taken into account. Since some businesses have inconsistent monthly results, comparing results at the same time of year allows for insightful comparisons.
- It enables business executives to set benchmarks. A company’s leadership team can determine growth trends and estimate a baseline revenue or other metric for forecasting by comparing results over a number of years using the year-over-year comparison.
- It is beneficial to investors. Investors can use the YOY comparison to estimate the value of their returns and determine whether the company is a good fit for them because the purpose of investing in a company is to support its growth and earn dividends.
What Does YOY Mean?
Year-Over-Year is a technique for examining several annualized sets of financial data from different years to determine how the data has changed.
Each data set must be from the same length of time in order to provide accurate context. The data observed in a year-over-year format can be taken from the span of different months, quarters, or even full years.
For example, one could examine a company’s first-quarter performance over the previous four years, but comparing a company’s Q1 2019 performance to that of January 2020 or Q3 2018 is not going to be useful.
How Is YOY Calculated?
YoY calculations are simple and typically given as a percentage. To do this, divide the value for the current year by the value for the previous year, then subtract one: (current year) ÷ (previous year) – 1.
YoY Formula:
The year over year (YoY) growth is computed by first dividing the value for the current period by the value for the previous period, and then subtracting one.
Growth Year-Over-Year (YoY) = (Value of Current Period ÷ Value of Prior Period) – 1.
Common Applications of Year-Over-Year
Business and finance professionals, such as investors, managers, and lenders, use year-over-year (YoY) comparisons. Below is a list of common use cases for the metric:
Revenue:
how much revenue has increased or decreased over the course of a year.
Profit: the amount of profit (also known as net income) that has increased or decreased over a given year.
Inflation:
the amount by which inflation (the change in the price of general goods and services) increased or decreased over a given year.
KPIs (Key Performance Indicators):
how key business drivers have increased or decreased over the past year. Common KPIs include the number of users, the speed of delivery, and the amount sold. Please keep in mind that key performance indicators (KPIs) vary by industry and company size.
what is Growth Year Over Year:
Year Over Year growth, or YOY growth, is the most popular use of Year Over Year data.It compares the annualized data of a business over two consecutive years that are exactly the same to see how the data has changed.
How to Calculate YoY Growth:
The term “Year-over-Year,” or YoY, refers to the rate of increase in a particular metric over two comparable times, like the current and previous periods.
The comparison of recent financial performance to previous eras is the goal of a year-over-year growth analysis, or YoY.
“Has the business been growing at a faster pace than the previous year, or has growth been slowing down in recent years?” is the question that a YoY growth analysis attempts to answer.
The amount for the current period is divided by the amount for the previous period, and one is then subtracted to get a percentage rate, which is the YoY growth rate.
Formula for growth from year to year:
Year-over-year growth is easy to calculate. Results are simple to obtain after gathering your data.
Subtract the number from this year from the number from last year to begin the equation. You will then have the entire year’s difference. You made money if the number is positive. You lost if the figure is negative.
Next, divide the difference by the amount from the previous year. This provides you with the growth rate from year to year.
To get the percentage change from year to year, multiply the result by 100 to convert it into a percentage.
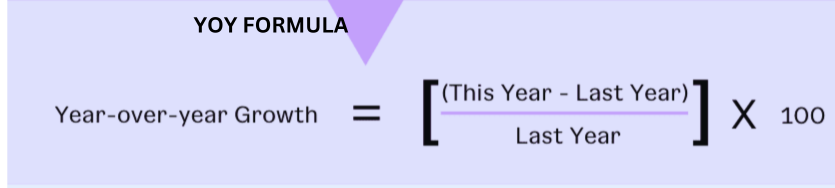
The formula for YOY growth is:
[(This Year – Last Year) / Last Year] X 100 is the year-over-year growth.
Year-over-year (YoY) FAQs
What does the acronym YOY stand for in finance?
YOY stands for year-over-year.
What is YOY?
Year-over-year is a method of comparing multiple annualized sets of a company’s financial data from different years to see how they have changed.
Why is YOY important?
The year-over-year format is an important tool for determining which direction a company’s financial performance is heading.
When should investors pay close attention to YOY?
Investors frequently place a high value on a company’s year-over-year growth when deciding whether to invest in it because it is one of the most visible indicators of a company’s long-term success.
How do you calculate the year-over-year change?
For example, assume a company’s net profit was $155,000 in the second quarter of 2018, then increased to $182,000 in the second quarter of 2019. To calculate the year-over-year percentage change, subtract $182,000 from $155,000, which equals $27,000. Divide $27,000 by $155,000. Then, multiply the result, which can be rounded to 0.1742, by 100. That figure represents the percentage change in the company’s net profit over the previous year.
For more information visit our Homepage
Very good https://lc.cx/xjXBQT
Thanks for comment
If you have love for Pets
Visit site
http://www.petsrearing.com
Good https://lc.cx/xjXBQT
hanks for comment
If you have love for Pets
Visit site
http://www.petsrearing.com
Good https://lc.cx/xjXBQT
Thanks for comment
If you love Pets and furry friends
Visit website
http://www.petsrearing.com
hanks for comment
If you have love for Pets
Visit site
http://www.petsrearing.com